
ATENA Animation of Temperature Evolution in Assessment of Thermal Loading on a Building Frame
Cross-section of the facade pillar connected to the inner wall - increase of temperature in the structure throughout 48 hours, structure is loaded by ambient temperature and solar radiation. See video.
Left diagram in video section - progress of temperature in time for western, southern and eastern side of pillar.
Right diagram in video section - progress of temperature in time for different locations along the depth of the pillar cross-section.
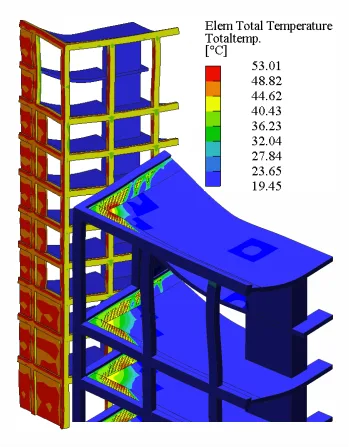
Fig.1: Example of thermal load on RC frame building due to sun
radiation and resulting slab cracking, slabs are modeled with shell
elements.